
Math and probability simulations
Chance is unpredictable one event at a time and regular in large numbers. These simulations repeat an experiment thousands of times in seconds, so randomness settles onto the shape probability theory predicts.
Galton Board pours balls through the rows of pegs Francis Galton used in the 1870s into a binomial pile that approaches the bell curve. Coin Flip Simulator tosses coins with the physics of their flight, including the slight same-side bias measured in 350,757 real flips. Probability Tree & Bayes drops balls through branches of conditional chances, so evidence turns a prior into a posterior by Bayes' theorem. Buffon's Needle estimates π from needles dropped on a floor of planks.
Brownian Motion & Random Walks follows a pollen grain kicked about by molecules, the jitter Einstein explained in 1905. Radioactive Decay gives every atom the same chance to decay at each moment, which adds up to a half-life curve; Ideal Gas & Entropy settles colliding molecules into the Maxwell-Boltzmann speed distribution; Percolation opens random cells until a path across appears at a critical chance.
Exact rules can look random. The collisions of two blocks in Colliding Blocks & Pi count out the digits of π, which Pi Search searches to a million places; Double Pendulum Chaos swings differently after a change of a billionth; Sorting Algorithms counts every comparison of nine sorting algorithms.
Two tools work with real data. Correlation & Causation plots real measures across countries with r, ρ and a fitted line, and draws cases from causal diagrams to show what a hidden cause or a selection does. Group Rates & Risk draws published rates for groups by sex and age as 1,000 people, with intervals for survey rates and samples to draw.
14 Math & Probability tools
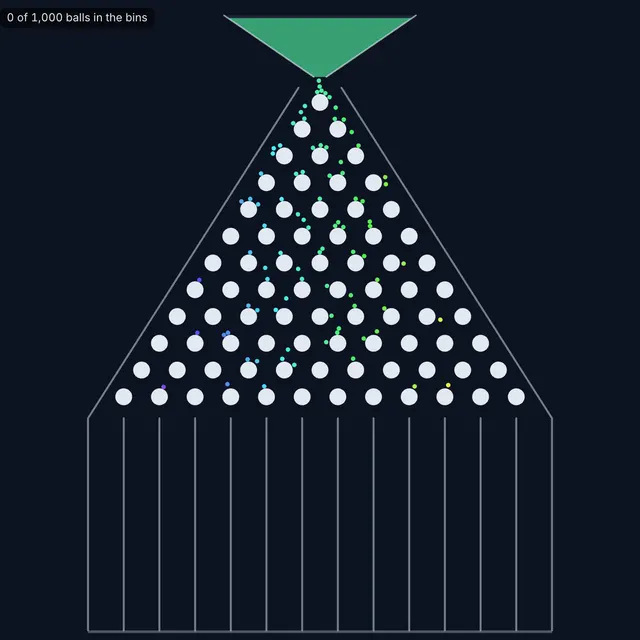
Galton Board
Pour balls through rows of pegs and watch them pile up into the binomial bell curve, with real bounces or exact coin flips.
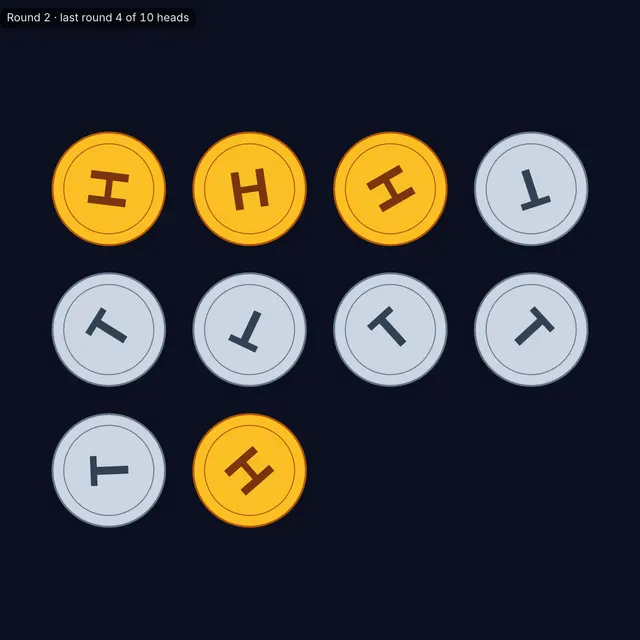
Coin Flip Simulator
Toss up to 100 coins with real flight physics and watch heads per round build the binomial distribution.
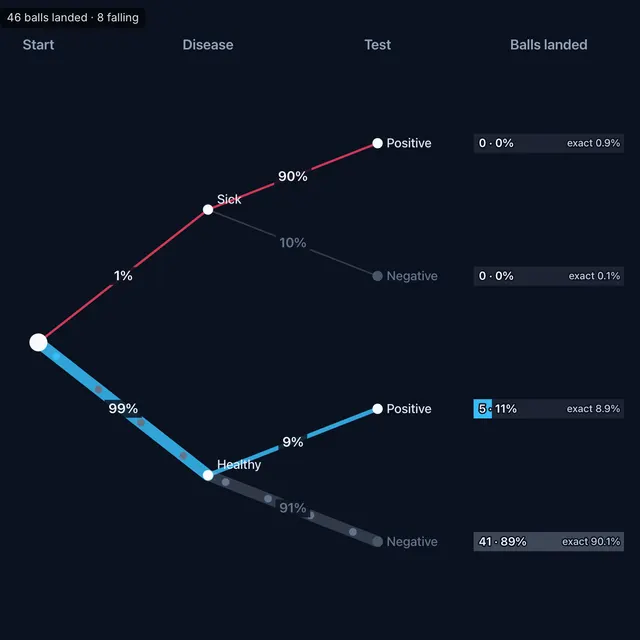
Probability Tree & Bayes
Build a probability tree, drop Monte Carlo balls through it and condition on evidence to see Bayes' theorem at work.
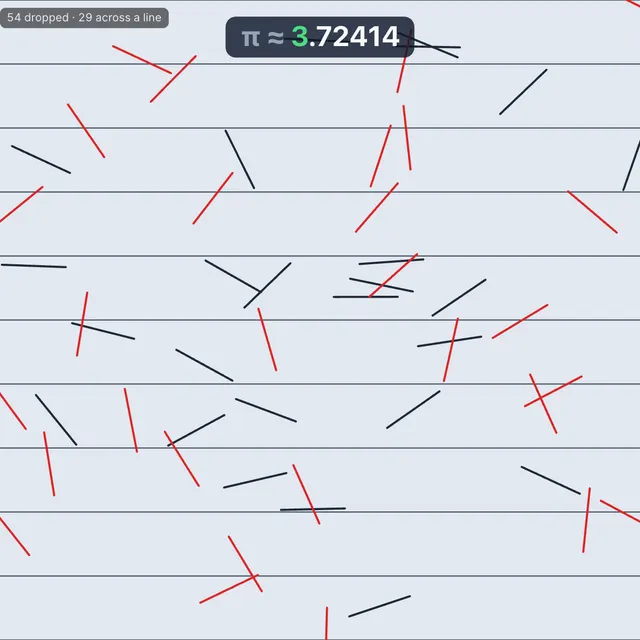
Buffon's Needle
Drop needles on a floor of planks and estimate π from the share that cross a seam.
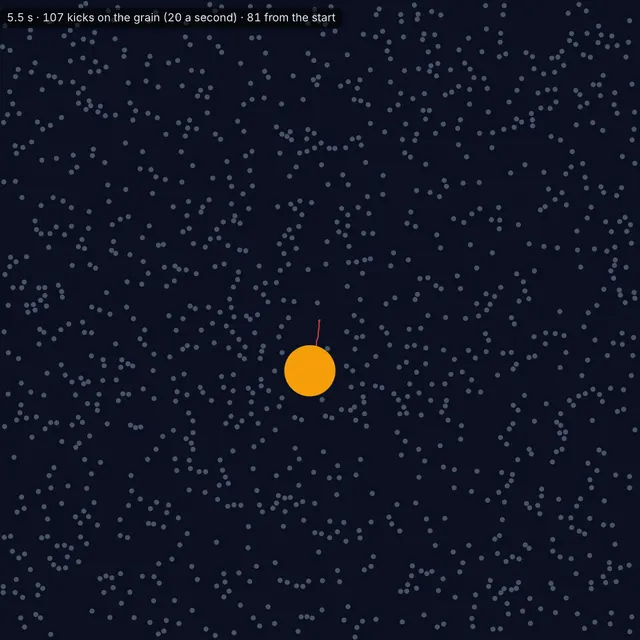
Brownian Motion & Random Walks
A pollen grain kicked by molecules, or a cloud of random walkers spreading like a drop of ink.
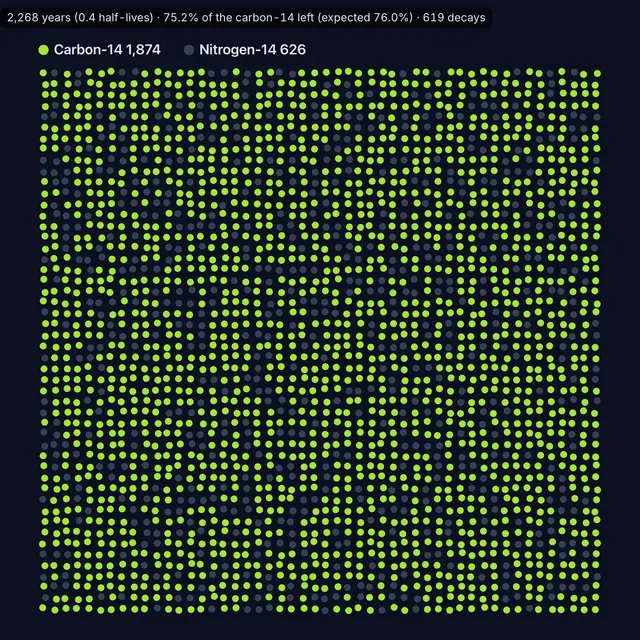
Radioactive Decay
Watch atoms decay one at a time and the sample halve every half-life, with Geiger counts that follow a Poisson law.
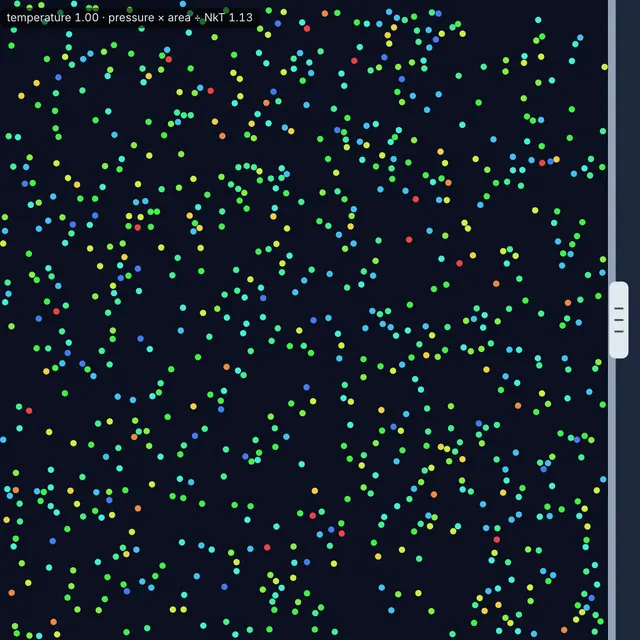
Ideal Gas & Entropy
Colliding molecules settle into the Maxwell-Boltzmann distribution; push a piston and track entropy as two chambers mix.
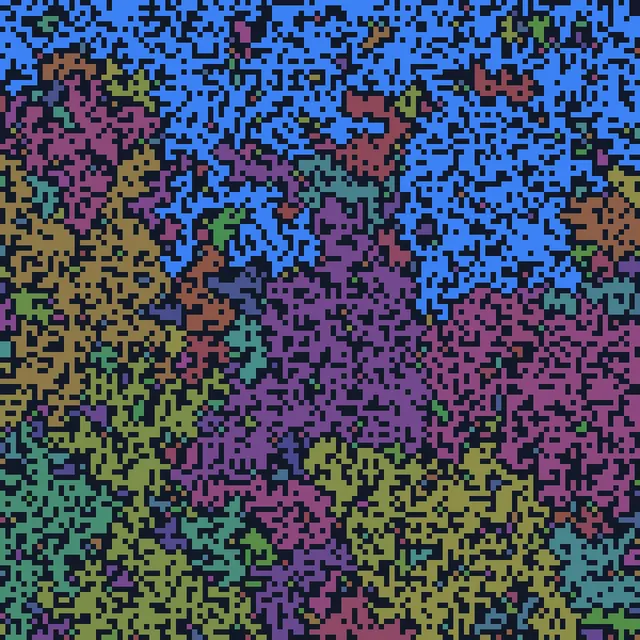
Percolation
Open cells at random and find the critical chance at which clusters join and water passes through.
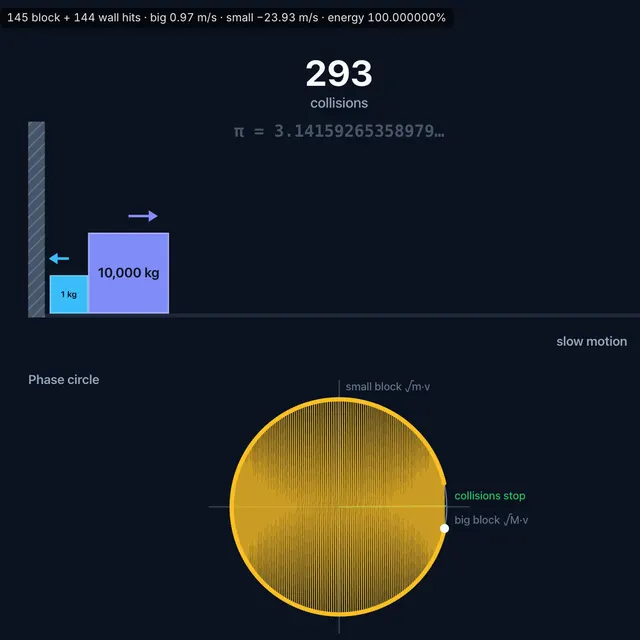
Colliding Blocks & Pi
Push a heavy block into a light one by a wall and count the collisions: with masses 100ⁿ apart, the count gives the digits of π.

Double Pendulum Chaos
Drag the bobs of a double pendulum and let go; copies started a trillionth of a radian apart soon diverge.

Sorting Algorithms
Watch nine sorting algorithms sort a row of bars and count every comparison and move, on five kinds of input or on bars drawn by hand.
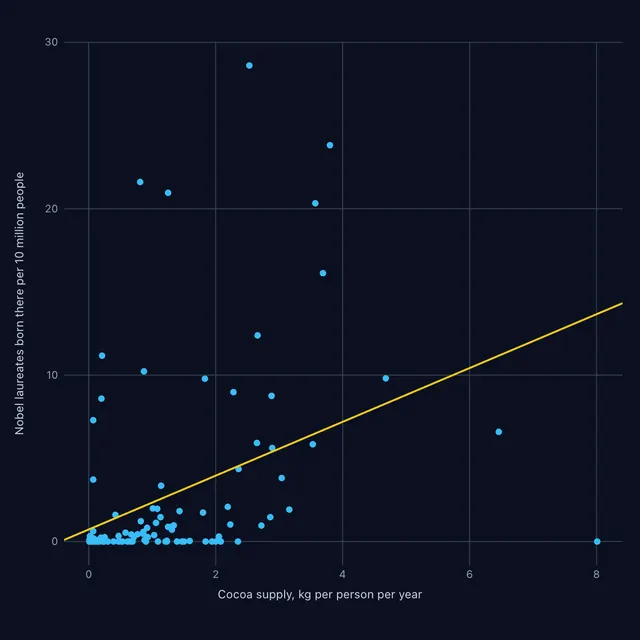
Correlation & Causation
Plot real measures across countries with r, ρ and a fitted line, draw cases from causal diagrams, and test many pairs with corrections.
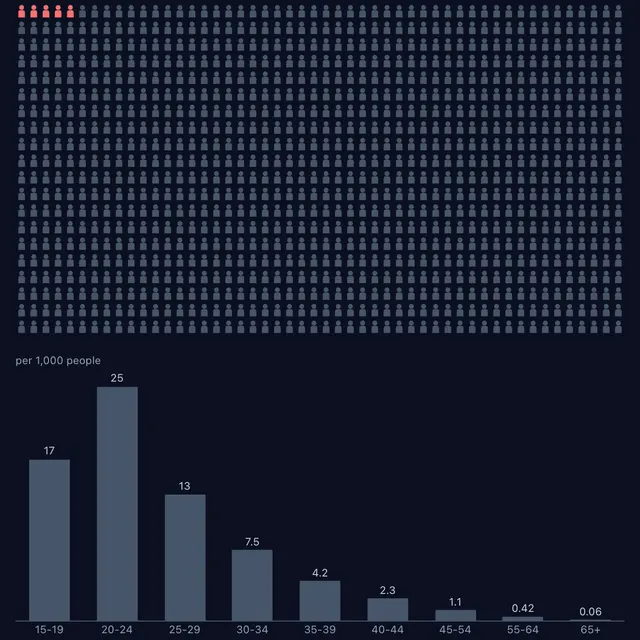
Group Rates & Risk
See a published rate as 1,000 people, compare groups by sex and age, and draw samples to see how sure a survey's share is.
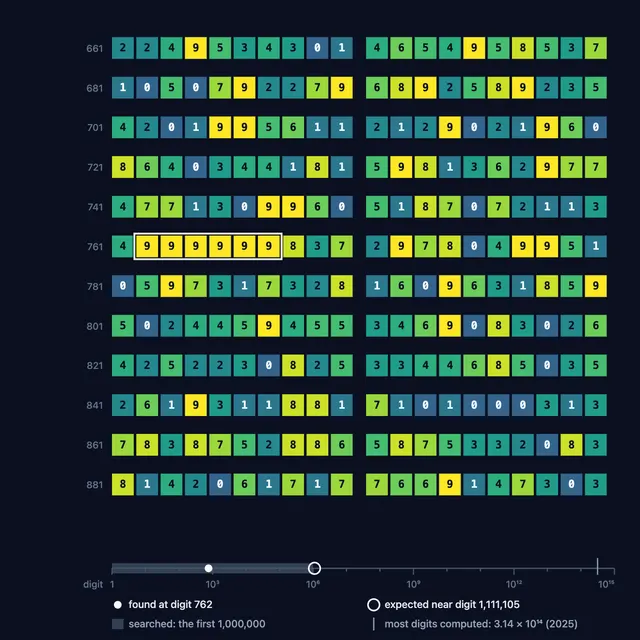
Pi Search
Search the first million digits of π for a number, a date, a word or a small picture and see where it first appears.
Frequently asked questions
What is a Monte Carlo simulation?
It answers a probability question by running a random experiment many times and counting the outcomes. The name comes from the Monte Carlo casino; Nicholas Metropolis and Stanislaw Ulam described the method in 1949. As the number of runs grows, the counted shares settle toward the true probabilities, which is the law of large numbers at work.
Why do so many things follow a bell curve?
When a result is the sum of many small, independent random pushes, the central limit theorem says its distribution approaches the normal curve, whatever each push looks like. A Galton board makes this visible: every ball's position is the sum of its left and right bounces.
Are these simulations good for class?
Yes. They're free, need no sign-up, run on Chromebooks and tablets, and keep their settings in the share link, so every student starts from the same experiment. Pause and Step let a class predict the next result before it happens.