
GeoPatternLab for teachers
GeoPatternLab is a free collection of interactive tools that make math and science visible: students draw with symmetry, build tilings and fractals, repeat chance experiments thousands of times, and run simulations of published models, from Conway's Game of Life to predator-prey ecosystems and epidemics.
Nothing needs installing and nobody signs up. Open a tool, set it up for your lesson and share the link: the settings are stored in the URL, so every student starts from exactly the same point, and the Share button can post straight to Google Classroom.
Tools by subject
Symmetry and transformations
Students draw one stroke and watch it repeat by reflection and rotation, which makes lines of symmetry and the order of rotation concrete. Try this: fold and cut a paper snowflake from a template printed with Snowflake Maker and find its six lines of symmetry, or predict how a stroke will repeat in Symmetry Group before switching groups.


Tilings and tessellations
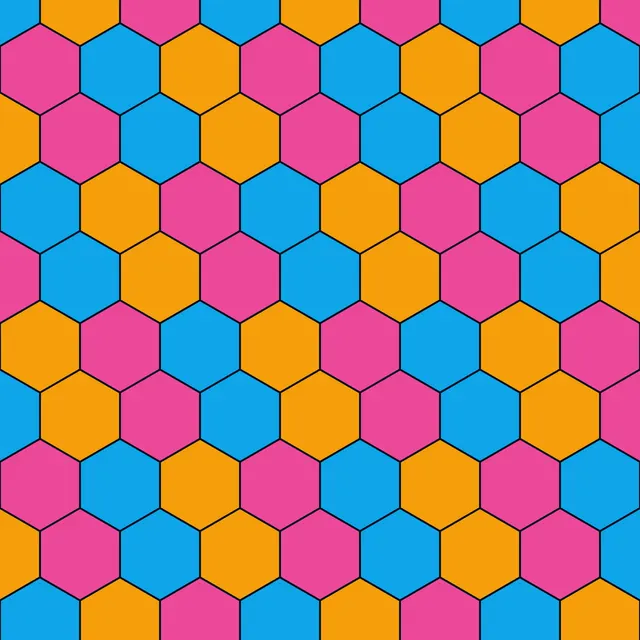
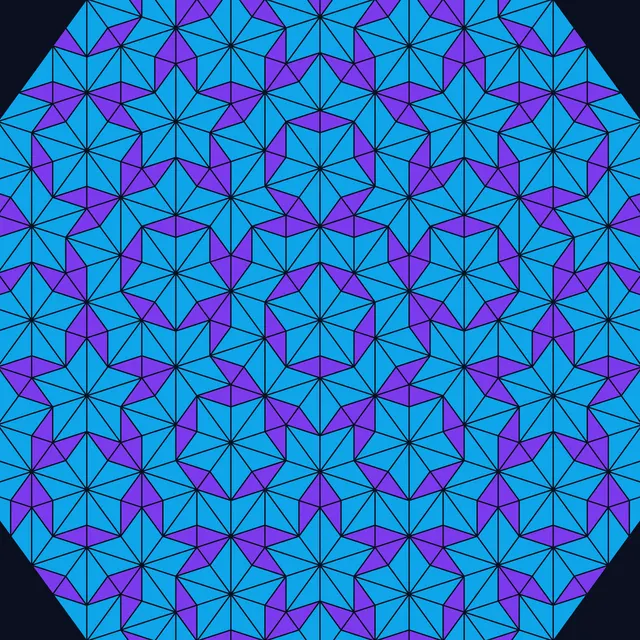
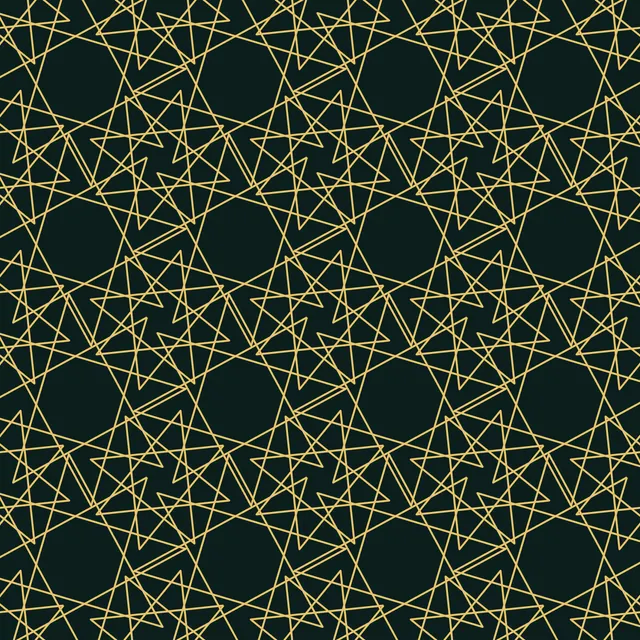
Students see why only triangles, squares and hexagons tile the plane on their own, how Islamic star patterns are constructed, and how a Penrose tiling covers the plane without ever repeating. Try this: color a tessellation in Tessellation Studio, then compare it with Penrose Tiling and discuss what changes when a pattern can't be shifted onto itself.
Fractals, sequences and curves
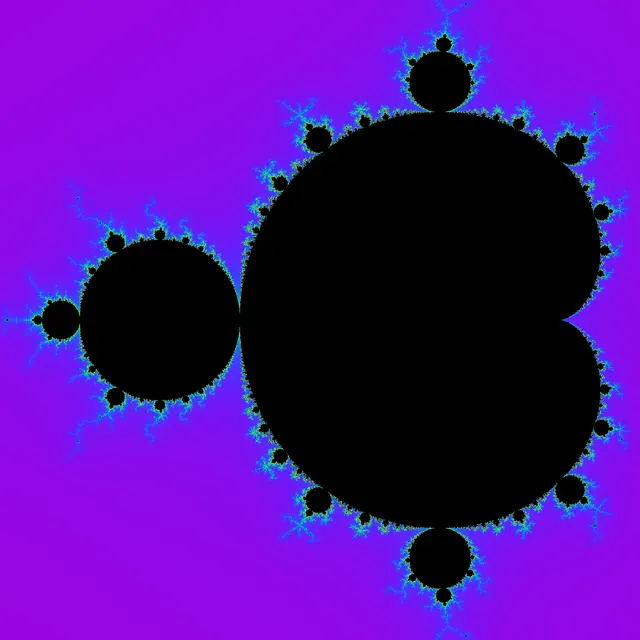
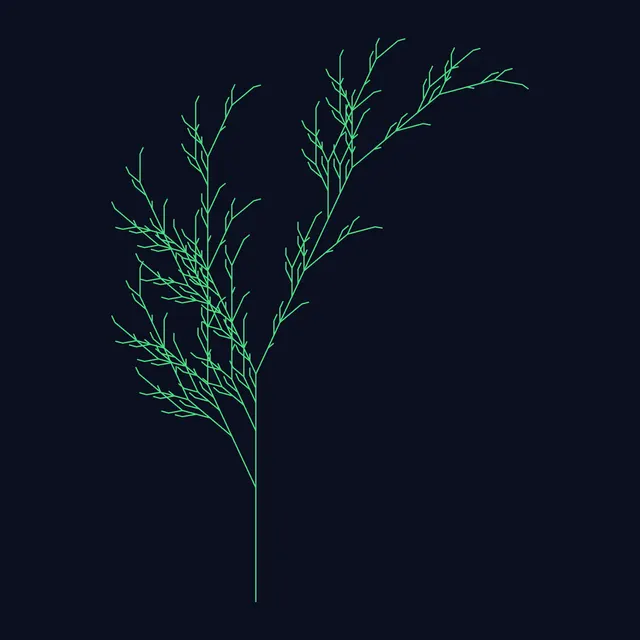
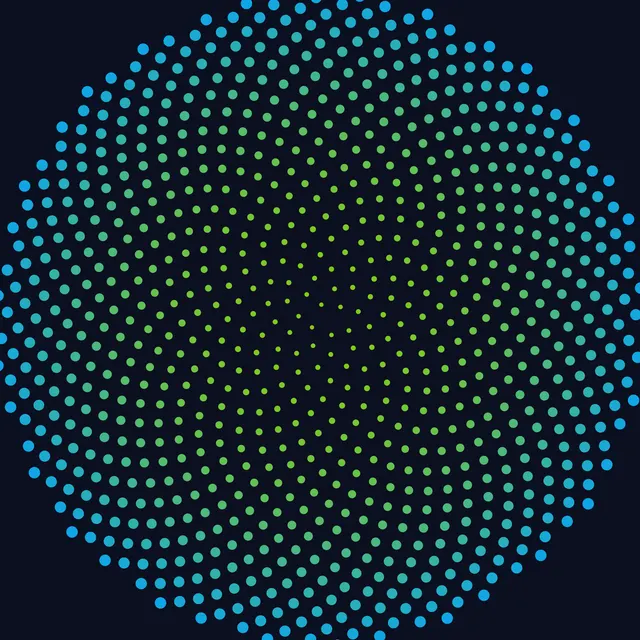
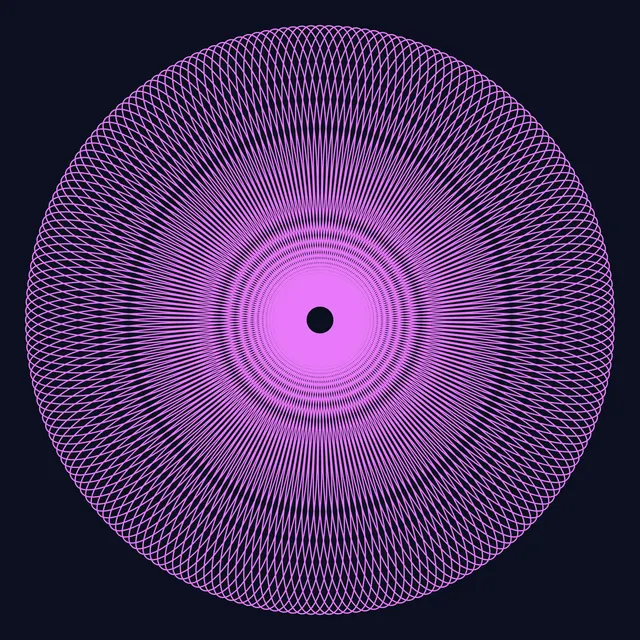
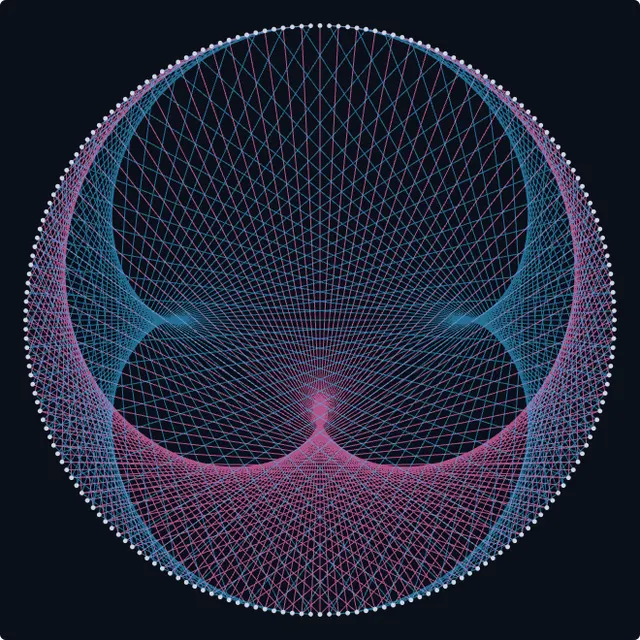
Fractal Explorer turns repeated complex-number arithmetic into images, Fractal Trees shows recursion with L-systems, and Spiral & Fibonacci links the golden angle to sunflower seeds. Spirograph and String Art Generator connect ratios and modular arithmetic to curves. Try this: ask students to predict which string art multiplier draws a cardioid, then check.
Probability and statistics
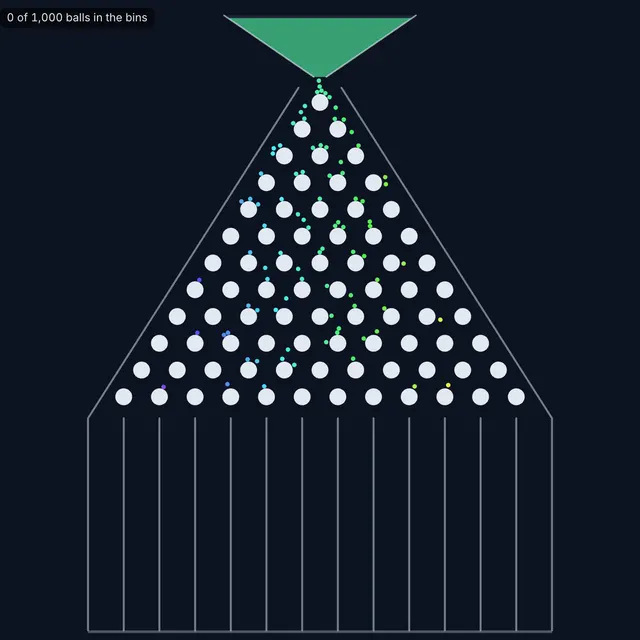
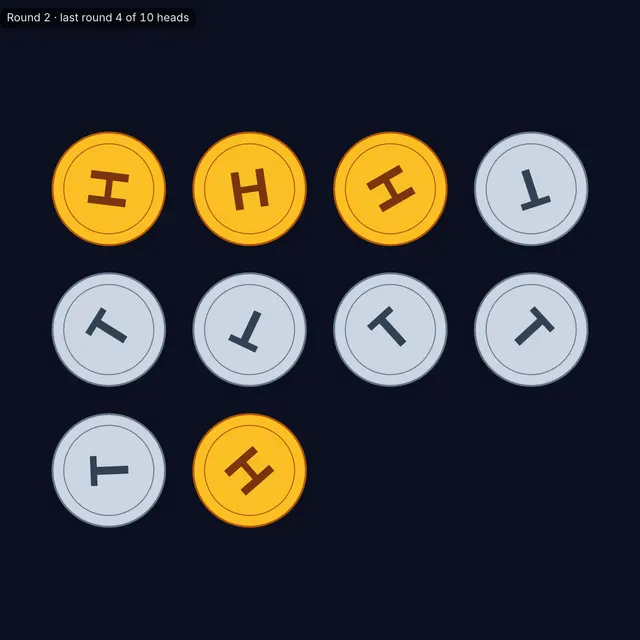
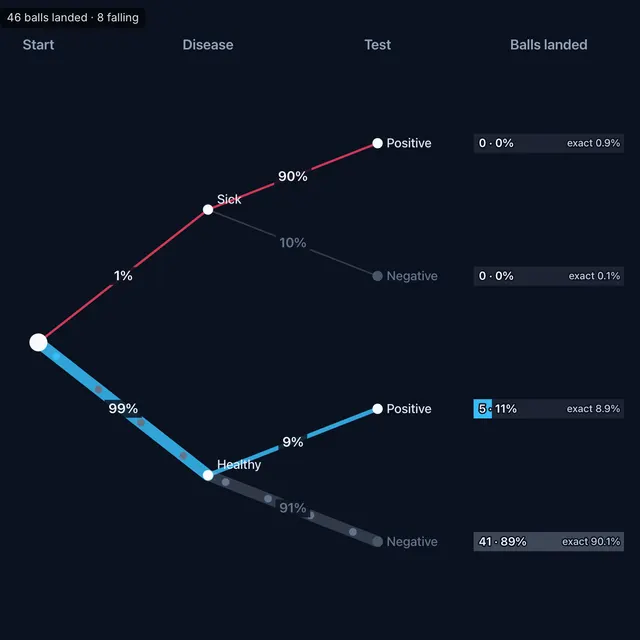
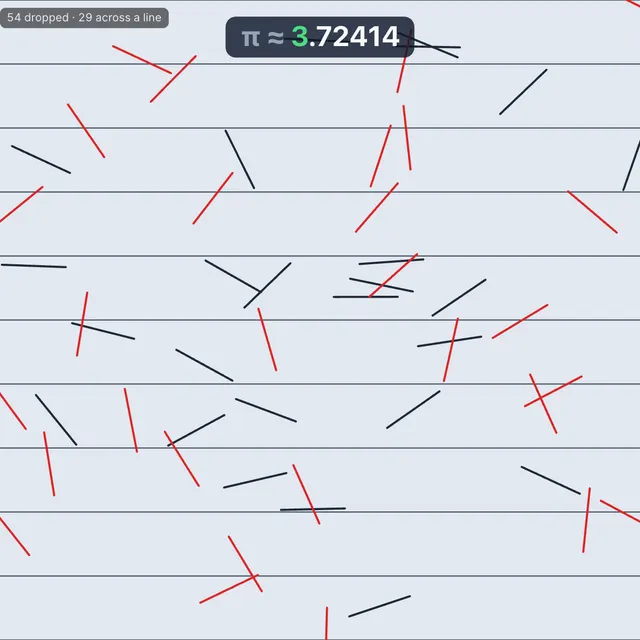
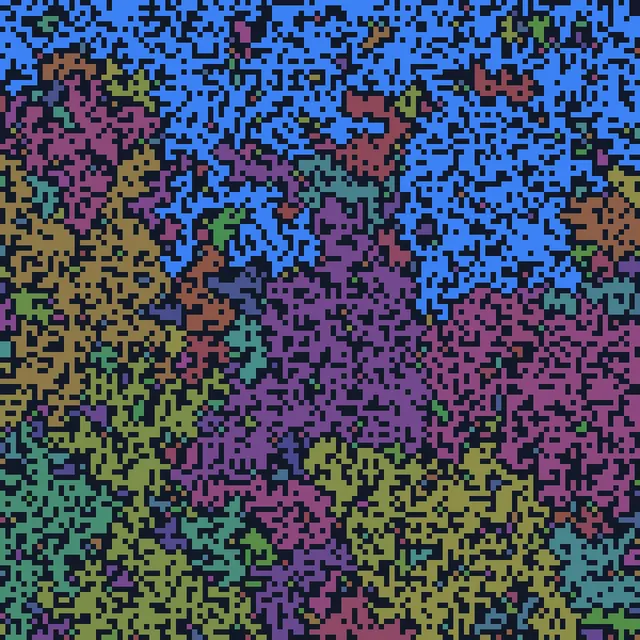
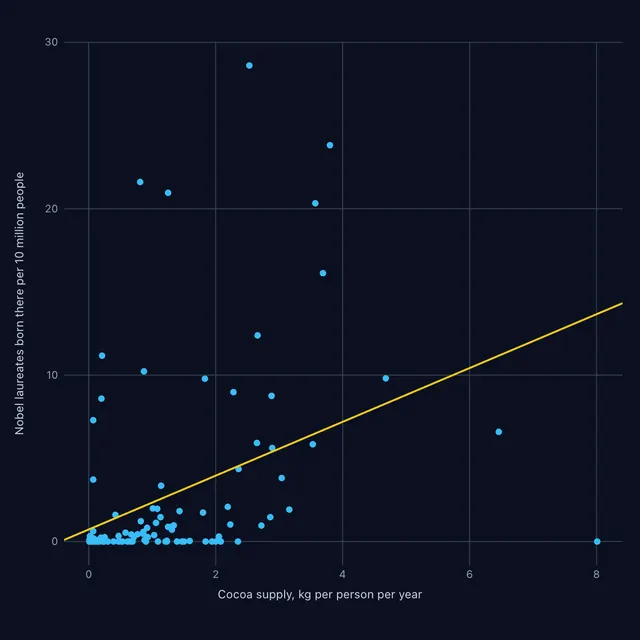
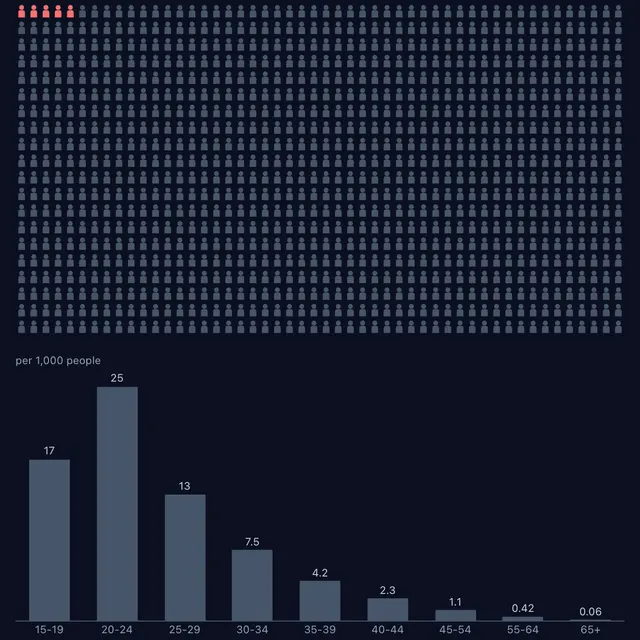
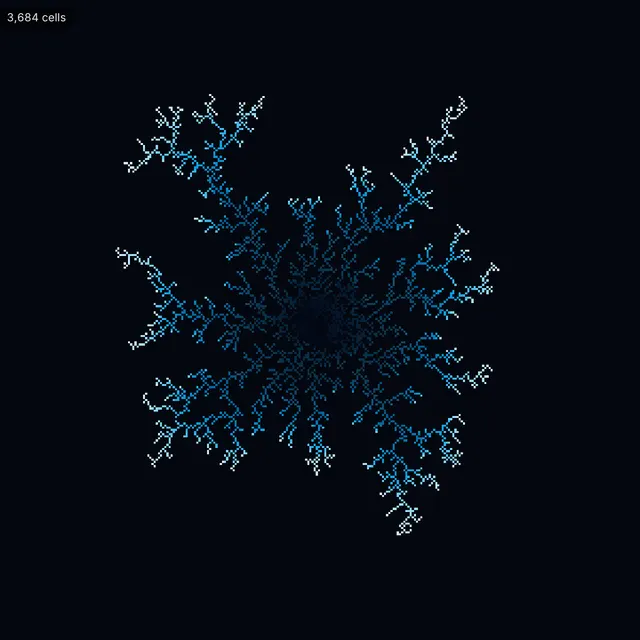
Students repeat chance experiments thousands of times and watch the counts settle onto the predicted distribution. Galton Board builds a binomial bell curve from bouncing balls, Coin Flip Simulator compares heads per round and the running share of heads with the binomial distribution and the law of large numbers, Probability Tree & Bayes turns tree diagrams into Monte Carlo simulations of conditional probability and Bayes' theorem, Buffon's Needle estimates π from dropped needles, and Percolation estimates how likely random open cells are to connect across a grid. Two tools use real data: Correlation & Causation fits lines to measures across countries and shows how a hidden cause or a selection makes a correlation, and Group Rates & Risk draws published rates for groups as 1,000 people and sets the chance in a group against the group's share of cases. Try this: have students type 50 made-up coin flips into Coin Flip's Randomness check box and compare their longest streak with a real run, or ask the class to guess what a positive medical test means before revealing the probability tree.
Computer science and emergence
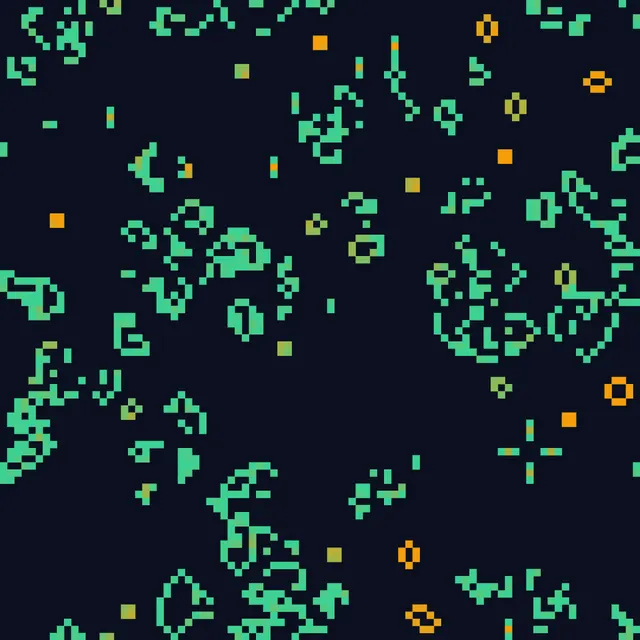
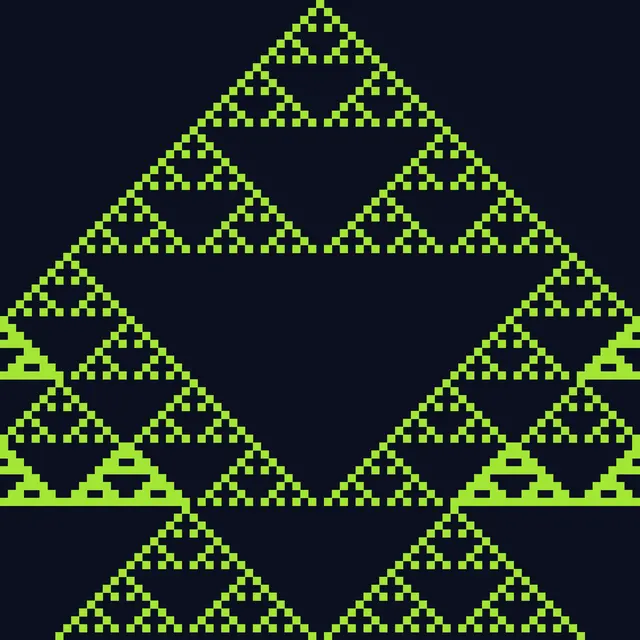
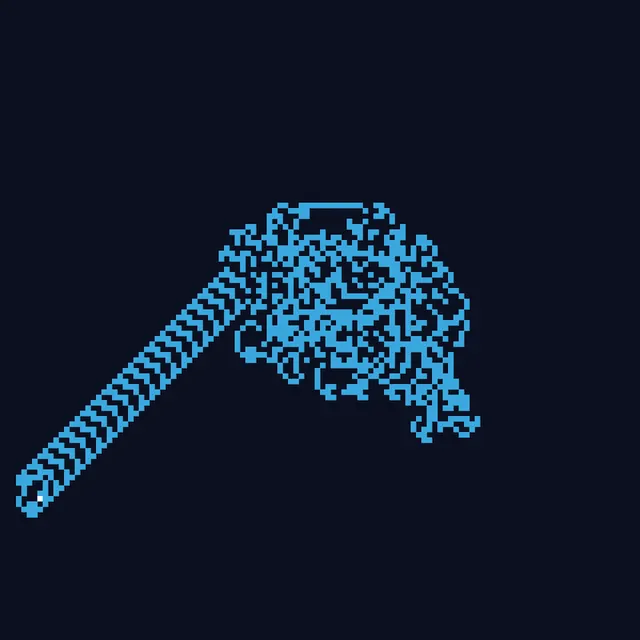
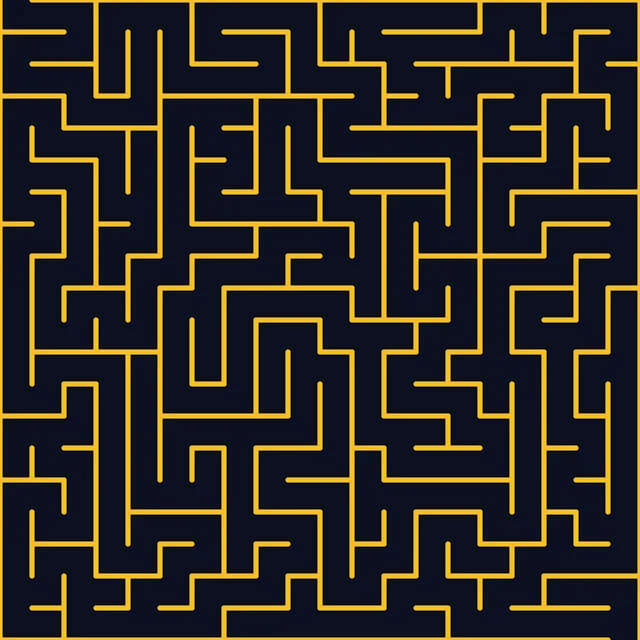
Cellular automata show how simple rules produce complex behavior, and even universal computation, and Sorting Algorithms counts every comparison and move of nine sorting algorithms, so efficiency can be measured rather than asserted. Try this: have students build a pattern in Conway's Game of Life that stays still, then one that moves, and write down the rule behind each, or predict which of insertion sort and selection sort makes fewer comparisons on a nearly sorted row before running both; Maze Art makes printable mazes, with answer keys, for lessons on depth-first search.


Life science and animal behavior
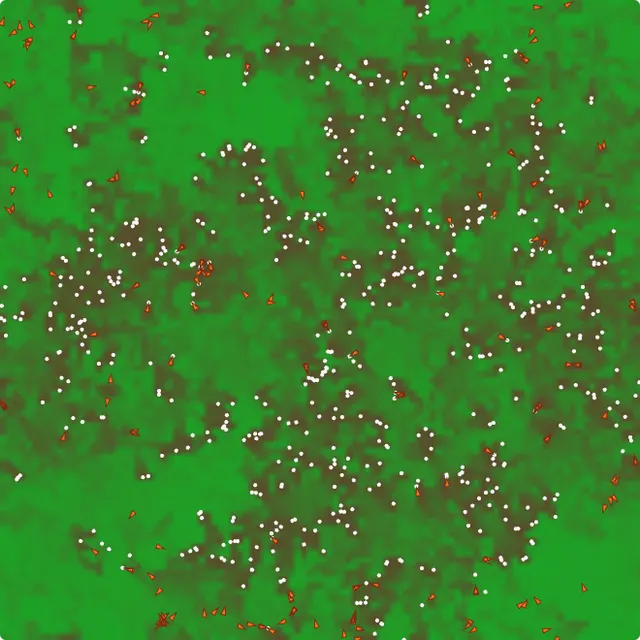
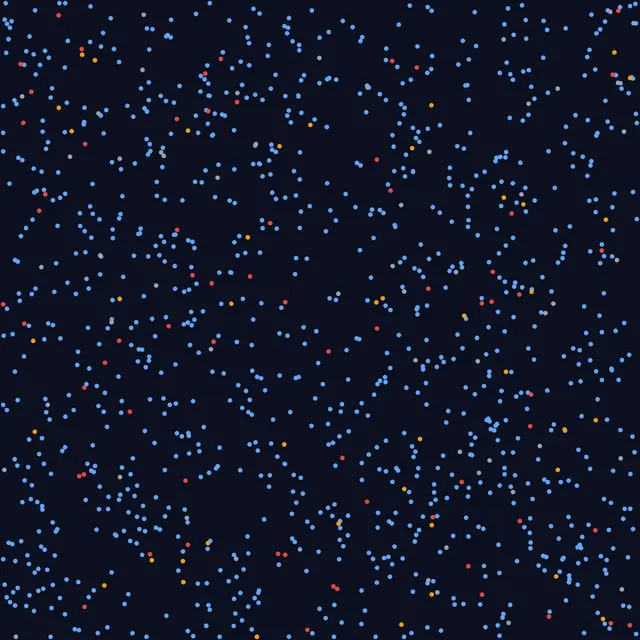
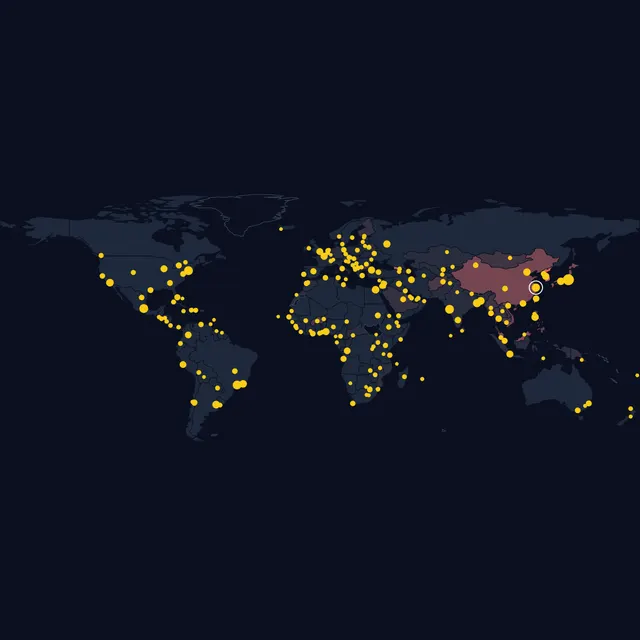
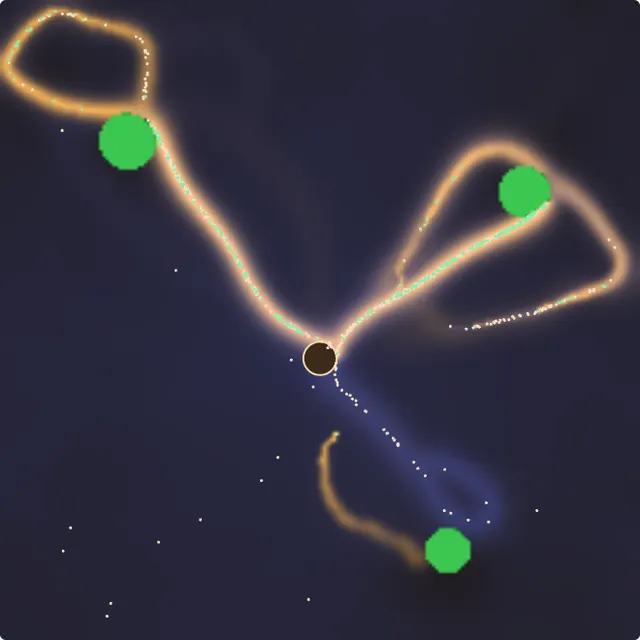
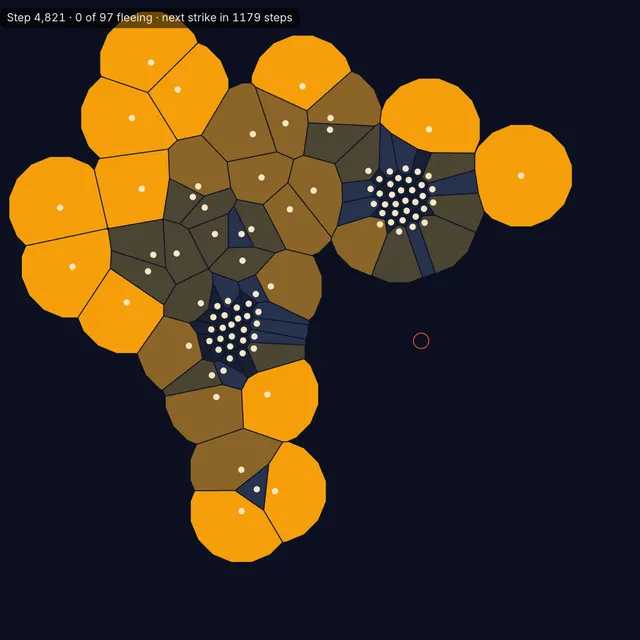
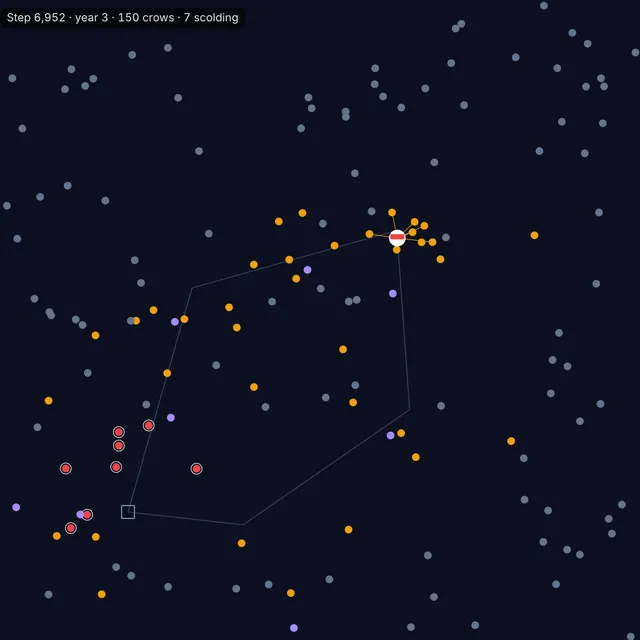
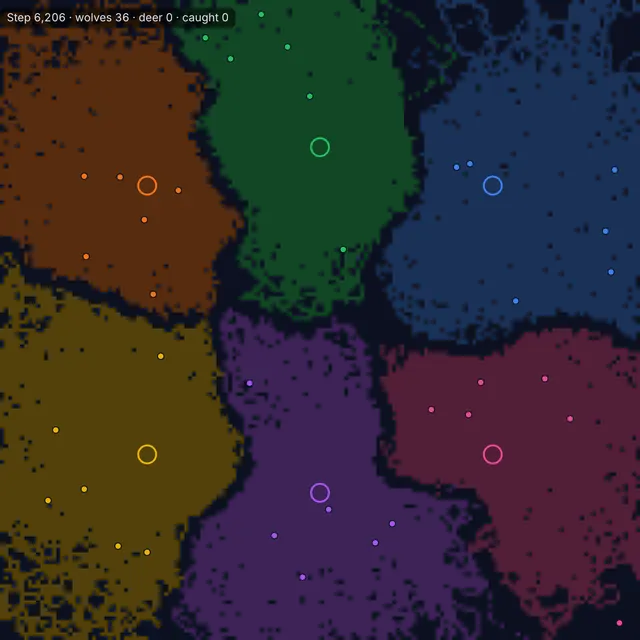
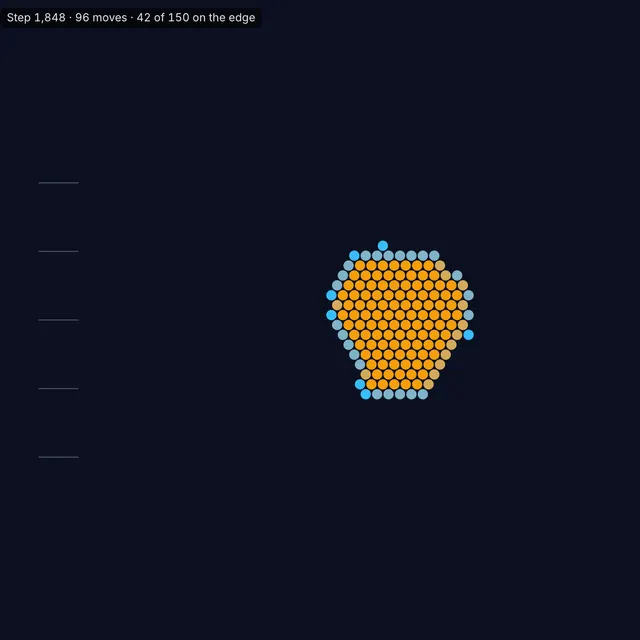
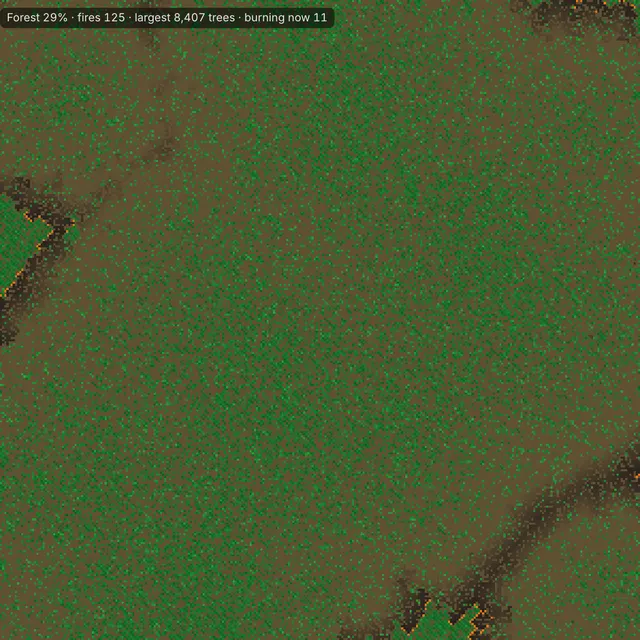
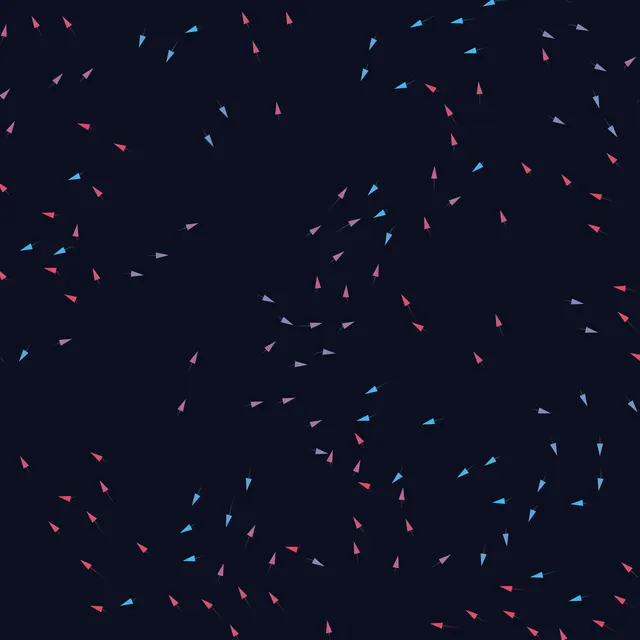
Agent-based simulations make populations and behavior visible: rabbits and foxes rise and fall in cycles in Predator-Prey Ecosystem, an outbreak grows and fades in Epidemic Spread and travels between 214 cities in Global Pandemic, ants find the shortest route to food by following pheromone trails in Ant Colony, honeybees move to the richer flower patch by dancing in Honeybee Foraging, termites raise pillars of soil in Termite Mound Building, a herd packs together under threat in Selfish Herd, crows pass on the face of a dangerous person in Crow Mobbing, wolf packs divide the land by scent marks in Wolf Pack Territories, and penguins share the warmth of a huddle in Penguin Huddle. Try this: compare the peak of the epidemic curve with and without distancing, or run Crow Mobbing with the neutral mask and then the dangerous one, and ask students why the experiment needs both.
Physics and Earth and space science
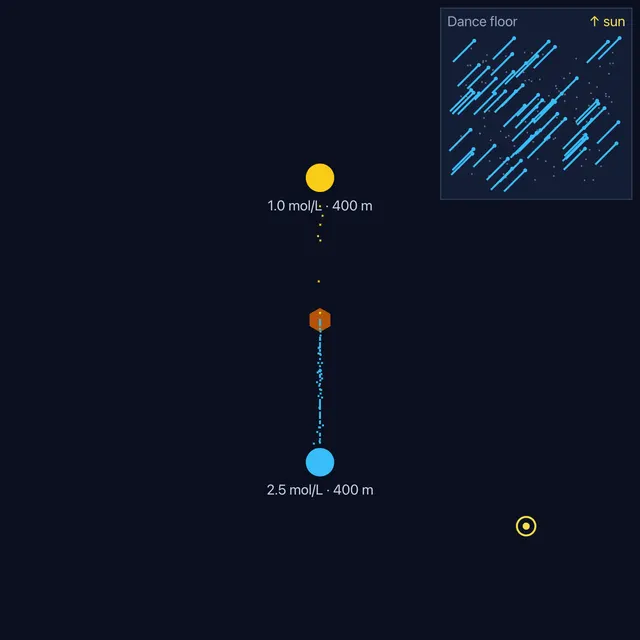
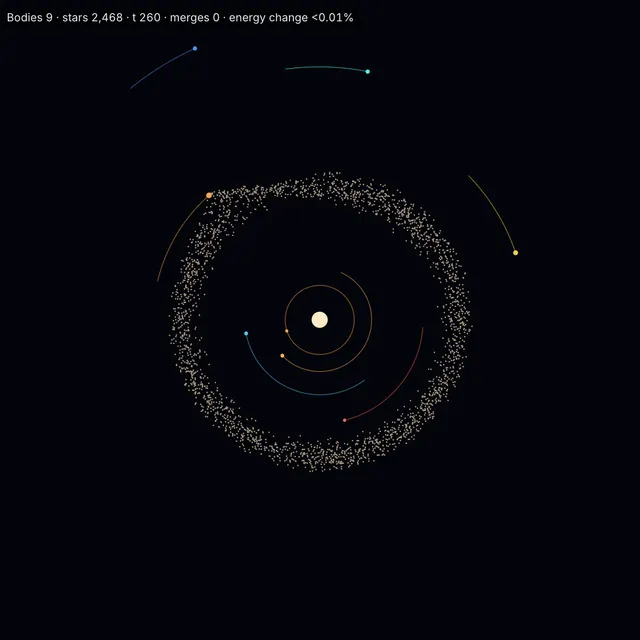
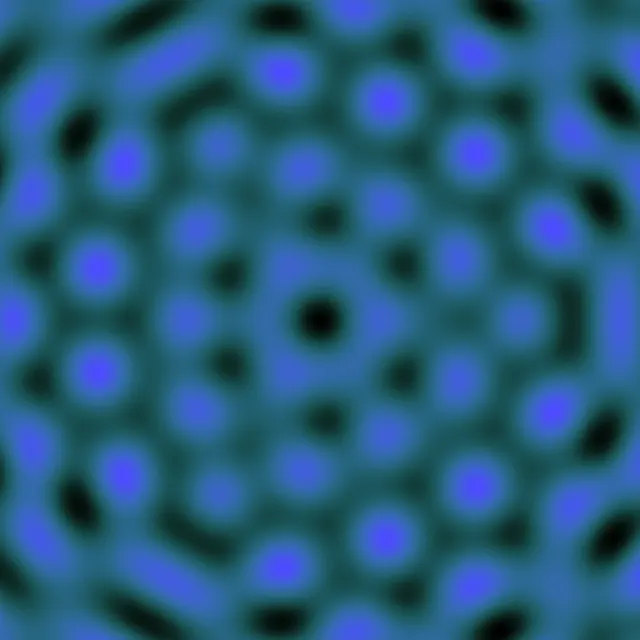
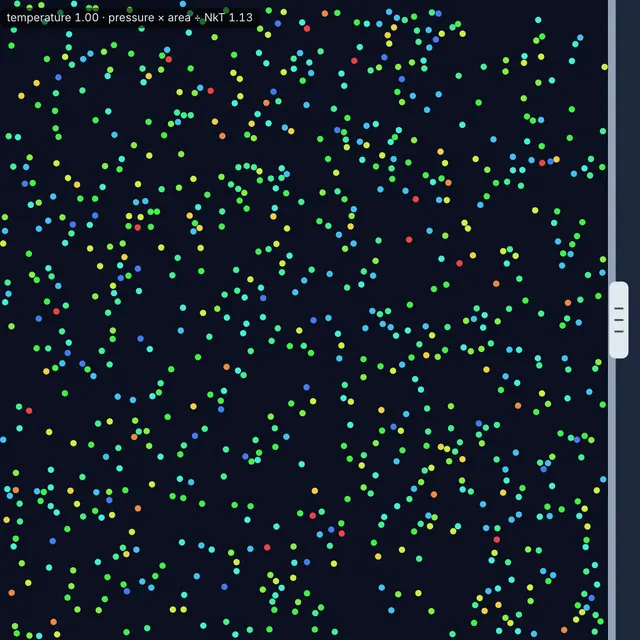
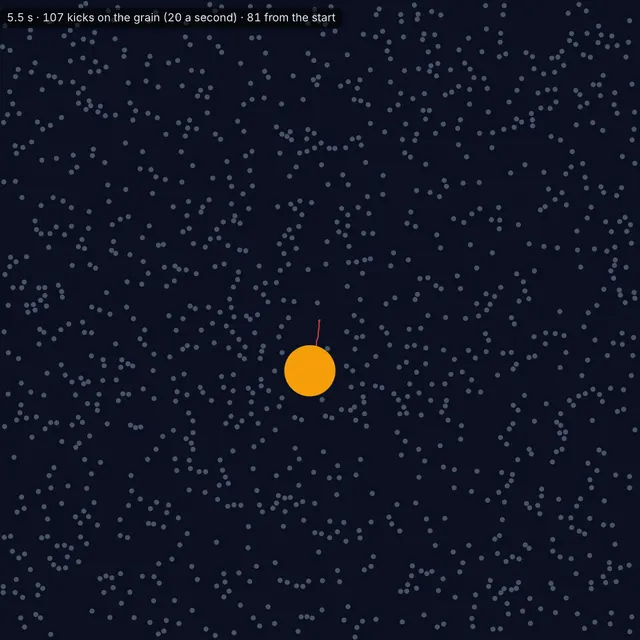
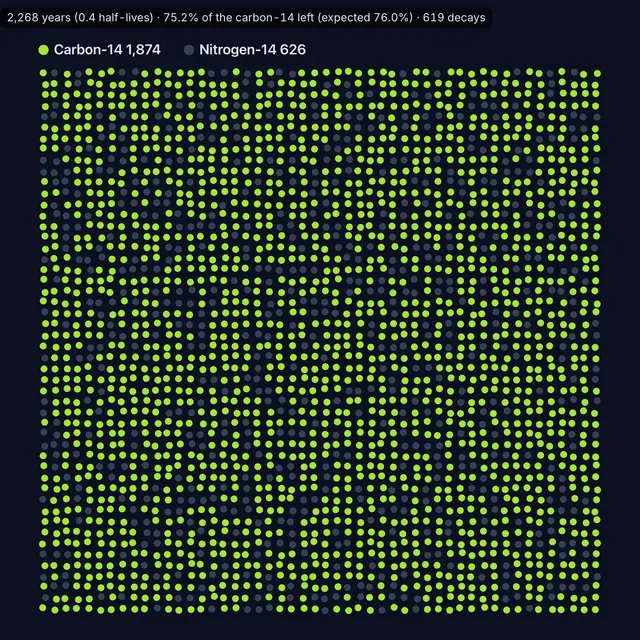
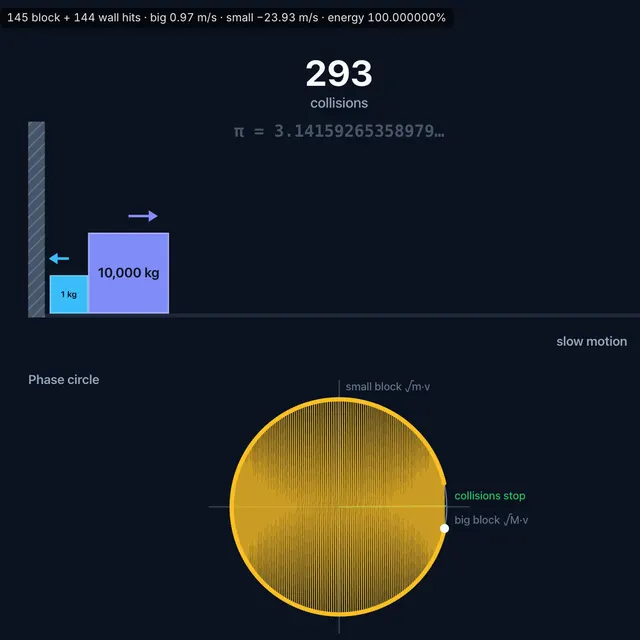
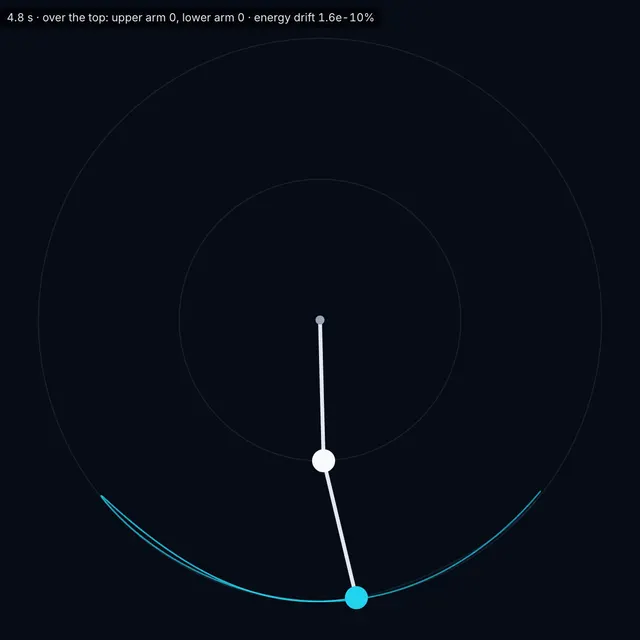
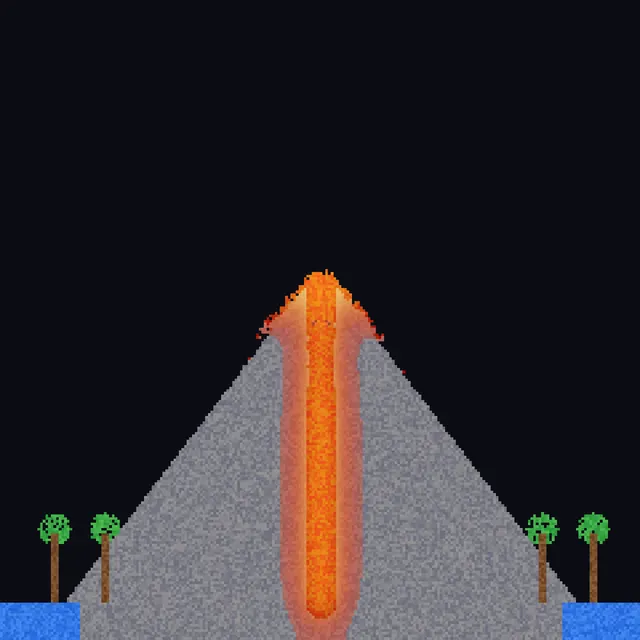
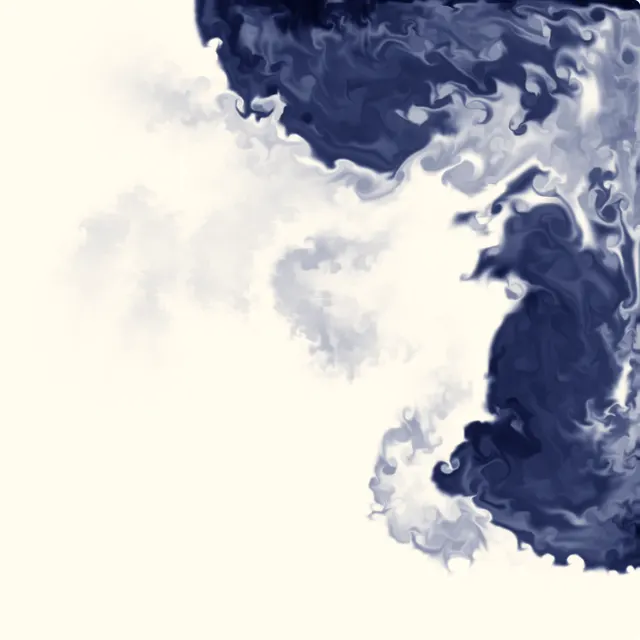
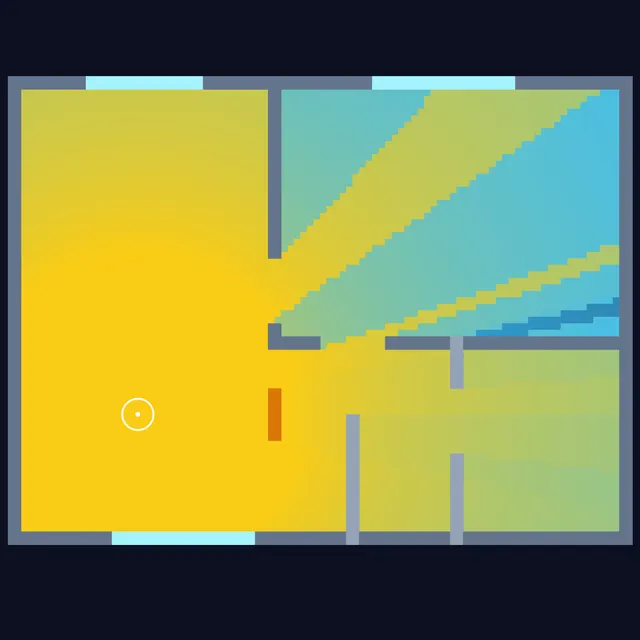
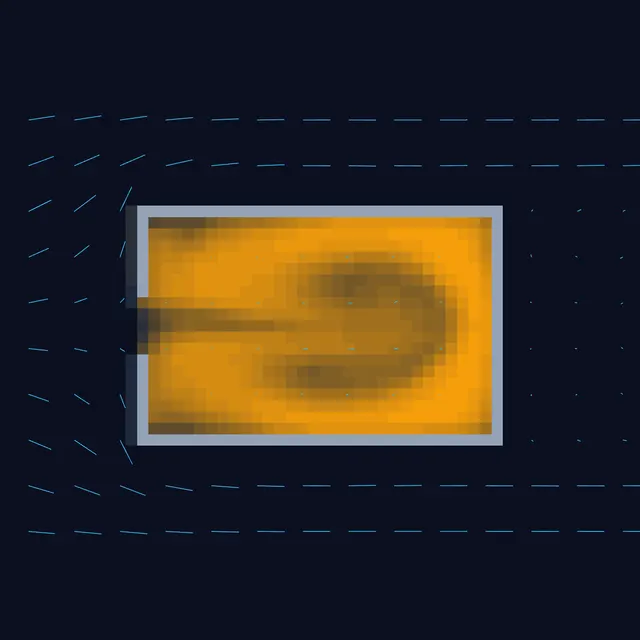
Gravity Sandbox computes Newtonian gravity for orbits, binary stars and colliding galaxies, Wave Interference shows the double-slit pattern, and Falling Sand and Ink & Smoke Fluid make heat, density and flow tangible. Ideal Gas & Entropy connects colliding molecules to pressure, temperature and the gas law, Brownian Motion & Random Walks shows the molecular kicks that convinced physicists atoms are real, and Radioactive Decay builds half-life curves atom by atom. Colliding Blocks & Pi puts conservation of energy and momentum to work counting collisions that spell π, and Double Pendulum Chaos shows how exact laws can still be unpredictable. Four tools take physics into buildings and landscapes: Wi-Fi Signal Map shows how much each wall weakens a router's signal, Room Airflow & Smoke compares one open window with two across a room for clearing smoke, Cloud Formation lifts moist air until it condenses into cloud and rain, and River Flood times when a flood reaches each house and tests a levee against it. Try this: launch a planet too slowly, then too fast, and compare the orbits, ask students to predict how many of 1,000 atoms remain after three half-lives, or have them predict which house the flood reaches first before pressing Play.

Crowds and traffic
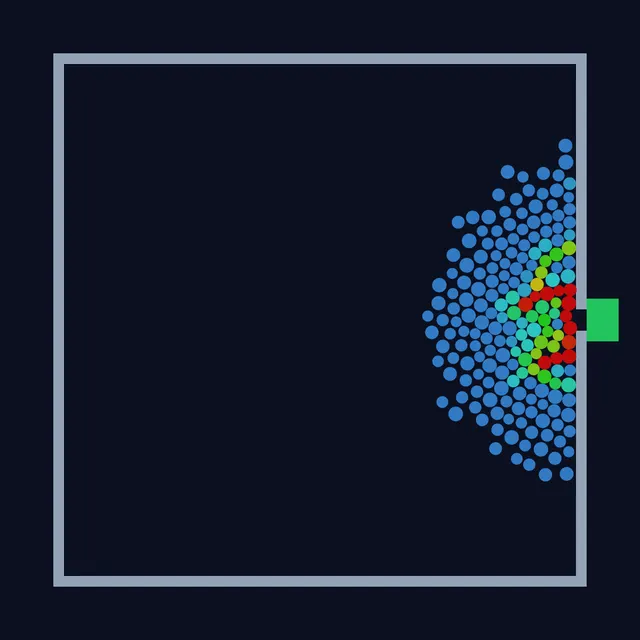
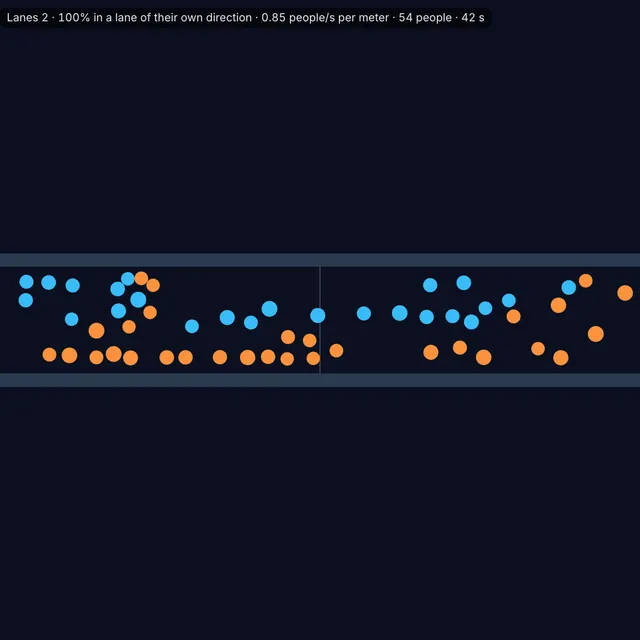
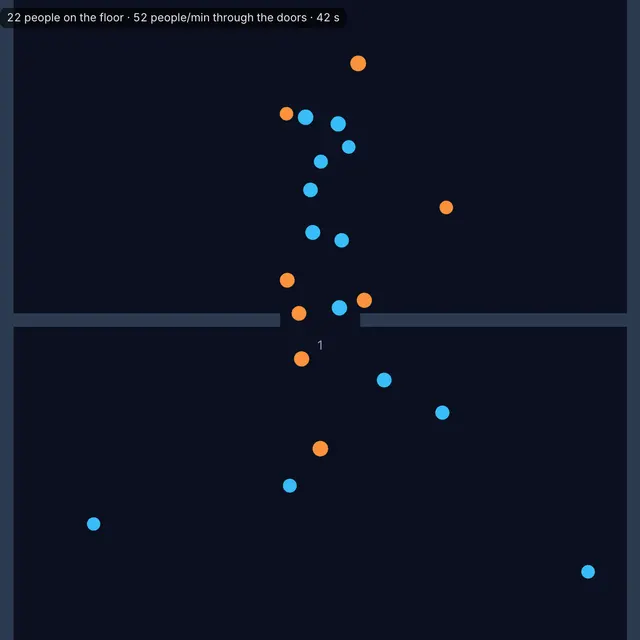
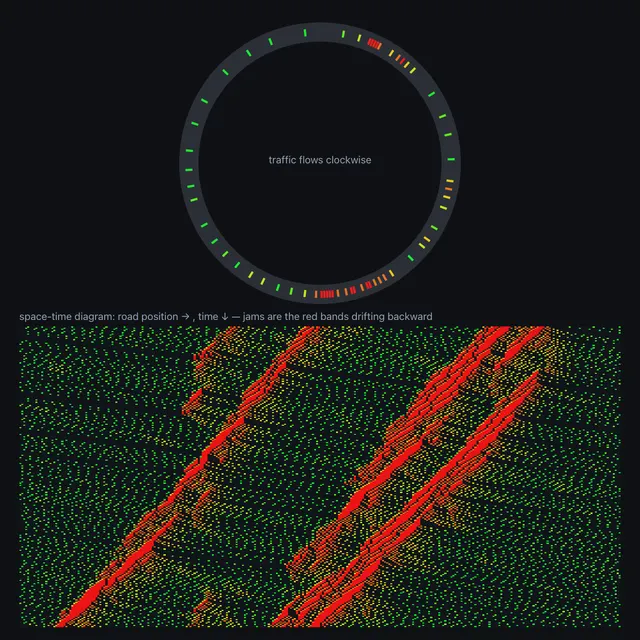
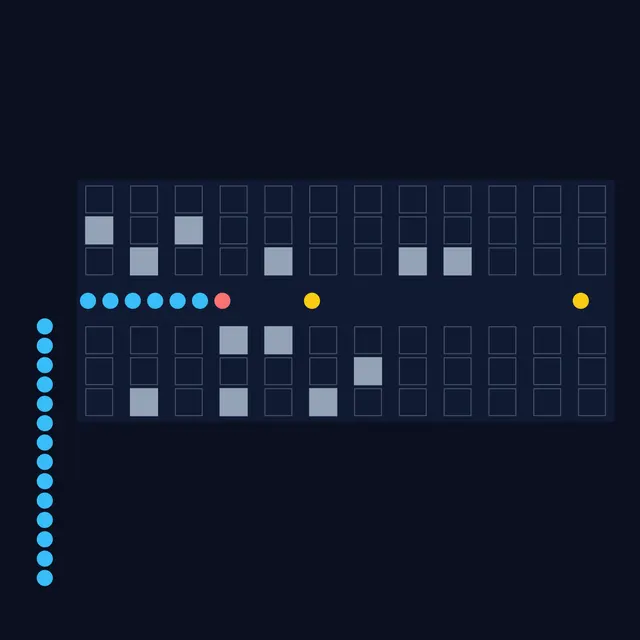
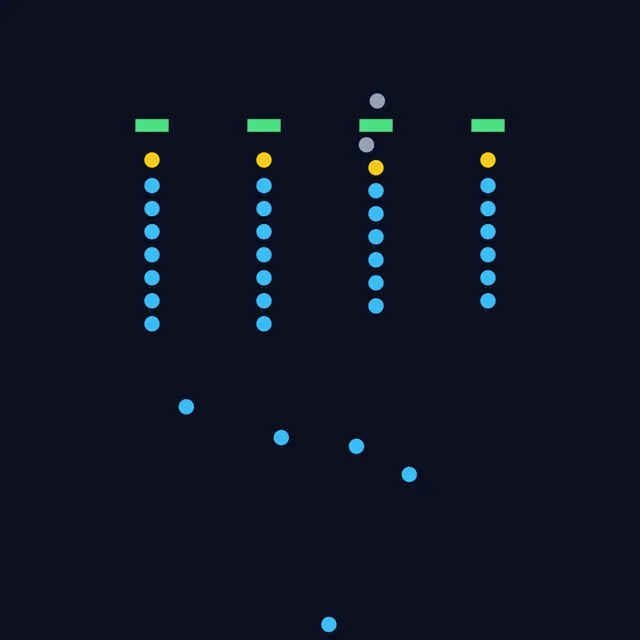
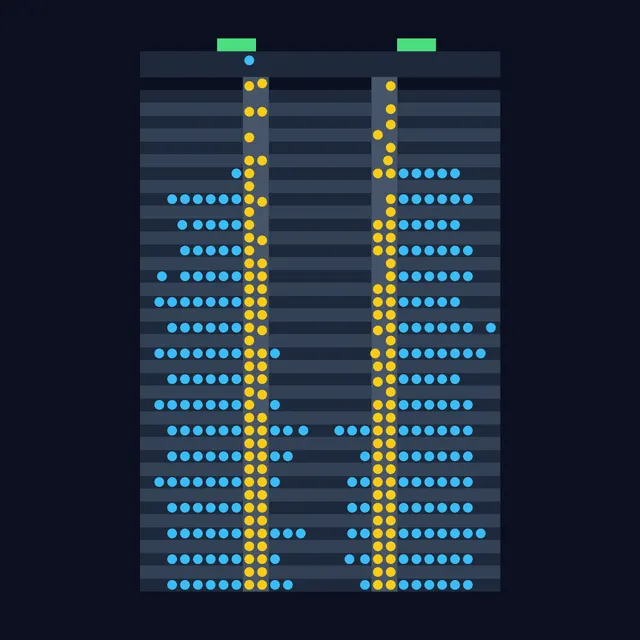
Models of people and cars show order appearing without a plan. Crowd Evacuation uses Helbing's social force model to empty a room and shows that pushing harder can make a door clog, Pedestrian Corridor lets two crowds sort themselves into lanes, Mall Entrance compares doors, turnstiles and a revolving door by throughput and waiting time, Parking Lot counts how often cars have to brake for walkers in different layouts, and Traffic Jam grows phantom jams on a ring road. Four more measure a bottleneck: Airplane Boarding times five boarding orders against the times Steffen and Hotchkiss measured, Checkout & Drive-Through sets one line against a line per cashier beside Erlang's formula, Intersection compares signals and an all-way stop by delay and near misses, and Stadium Exit shows whether the aisles or the vomitories set the time to empty a stand. Rumor Spread passes a story along a network and stops it when its spreaders meet people who already know it. Try this: have students predict how many lanes form in a 4 m corridor before pressing Play, then change Corridor width and test their rule, ask which parking layout gives the fewest conflicts and let them check each one with the same arrivals, or have the class rank the five boarding orders before running them.


Art and mindfulness
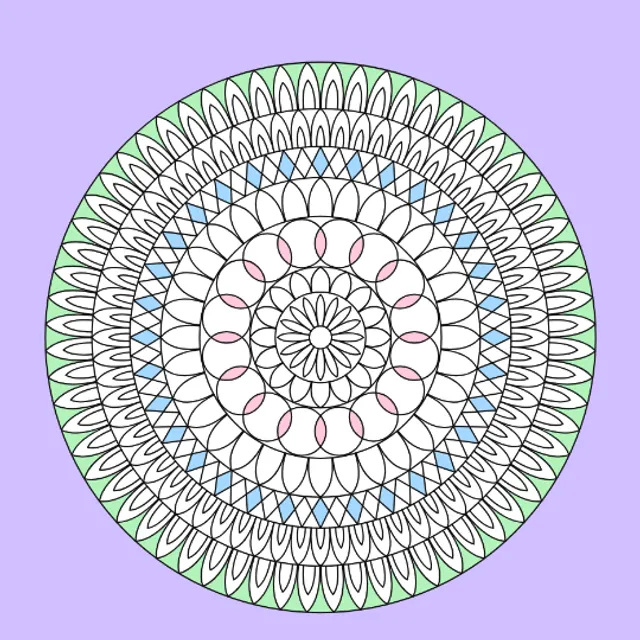
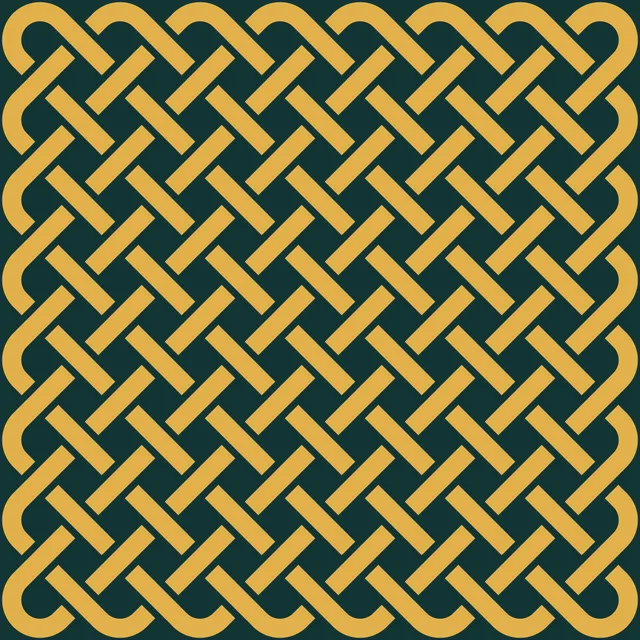
Mandala Coloring Page prints on US Letter or A4 and can make a different design for every student, while Zentangle Patterns, Op Art Generator and Celtic Knot connect art history to geometry. Try this: print simple mandalas for a calm start to class, or ask students to explain why an op art pattern seems to move.

Standards these tools support
Suggested alignments with the Common Core State Standards for Mathematics, the Next Generation Science Standards and the CSTA K-12 Computer Science Standards (2017). Check them against the curriculum you teach.
Tips for class
- Set up a tool, press Share and copy the link or send it to Google Classroom: everyone opens the same settings.
- Pause and Step stop a simulation so the class can predict what happens next, one step at a time.
- Print what you make: coloring pages, mazes with answer keys, snowflake templates, and PNG exports for slides and worksheets.
- Tools run in a current browser on laptops, Chromebooks and tablets; the GPU-heavy ones, such as Fractal Explorer and Ink & Smoke Fluid, run best on newer devices.
Frequently asked questions
Is GeoPatternLab free for schools?
Yes. Every tool is free to use in class, with no accounts, licenses or installs. Students only need a link and a current web browser.
Do students need to sign up or share personal information?
No. There are no accounts or logins. Drawings and settings stay in the browser unless a student chooses to export a file or share a link. The Privacy Policy explains how the site handles analytics and advertising.
How do I share a setup with my class?
Open the tool, set it up, then press Share. Copy the link or send it straight to Google Classroom; the settings are stored in the link, so every student starts from the same setup.
Are the simulations accurate enough for science class?
They implement published models, named and cited on each tool's page, simplified to run in real time. They're designed to build intuition and spark discussion, not to make forecasts or engineering decisions.
Which grades are the tools for?
The drawing and coloring tools work from elementary school up, the symmetry, tiling and fractal tools suit middle and high school math, and the simulations fit middle school through college science and computer science.
Using GeoPatternLab in class? Tell us what works, what you'd like added, or share a lesson idea at hello@geopatternlab.com.