
Epidemic Spread
An agent-based SEIR outbreak — flatten the curve with distancing, quarantine, masks and vaccines.
- Susceptible
- Exposed
- Infected
- Recovered
Blue people can catch the disease, orange have caught it but aren't contagious yet, red are infectious, gray have recovered and purple are vaccinated. Click to start an outbreak there, an event in time that Restart and share links leave out; then try the measures to flatten the curve.
How is Epidemic Spread working for you?
About Epidemic Spread
Good for: Learning by watching
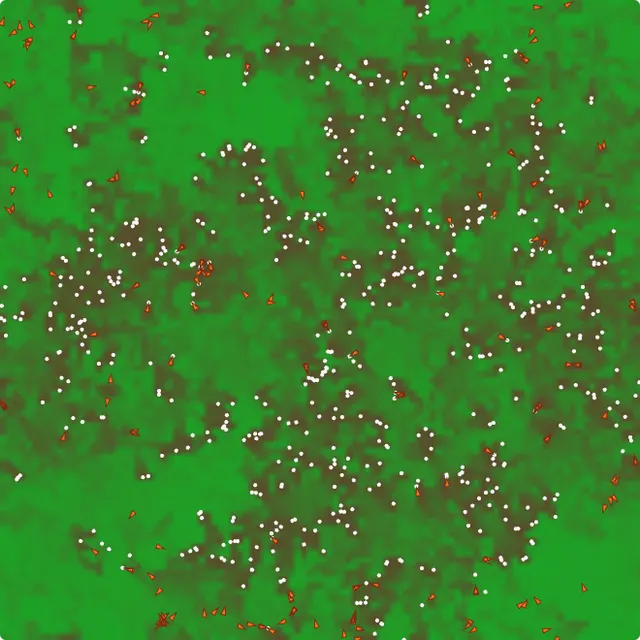
Epidemic Spread is an agent-based simulation of how an infectious disease moves through a town. Every dot is a person who is Susceptible, Exposed (infected but not yet contagious), Infectious, Recovered or Vaccinated — the SEIR model epidemiologists have used since William Kermack and Anderson McKendrick's work in 1927, here played out one person at a time. People wander around town or commute between their neighborhood and a busy market, and each hour spent close to an infectious person carries a small chance of catching the disease.
The stacked epidemic curve shows the outbreak take off, peak and burn out as people recover and fewer susceptible people remain. A second chart estimates the reproduction number R — the average number of people each infected person goes on to infect — from who actually infected whom. Above the dashed line at 1 the outbreak grows; below it, it shrinks.
Try the measures that public-health agencies use: distancing keeps a share of people at home, quarantine isolates detected cases a day or two after they become contagious, masks halve transmission for each masked person, and vaccination makes people immune at the start or day by day. Four more options go further: Super-spreading draws each person's infectiousness from a gamma distribution, as James Lloyd-Smith and colleagues modeled it in 2005; Tests per day limits how many of the people quarantine finds can isolate each day; Contact tracing isolates the people an isolated person infected after a delay; and a lockdown can start and end at set shares of people infectious. Care capacity draws a line on a chart of people infectious now. Each run that ends adds a row to the Runs table, so settings can be compared side by side. Switch to fading immunity to see repeated waves, click anywhere to start new outbreaks, and export a PNG, video, GIF or CSV.
How to use Epidemic Spread
- Press Play. A few first cases (red) appear among susceptible people (blue). Each step is one hour; at the default Speed the town lives 2.5 days per second. People move and anyone close to an infectious person may become exposed (orange).
- Read the charts. The Epidemic curve stacks the number of people in each state over time. Estimated R shows how many people each case infects on average; the dashed line marks 1. R stays blank until 8 people have recovered, the fewest it is estimated from.
- Change how people move. Wander moves people randomly around town; Commute to market sends most of them to a central market during the day, which speeds up spread.
- Change the disease. Infectiousness is the chance per hour of close contact; Contact distance is how close counts as close; Incubation and Infectious for set how long each stage lasts; Immunity sets whether recovered people can catch it again.
- Try measures. Raise Distancing, Quarantine, Masks or vaccination and press Restart to run the outbreak again. Distancing and masks update live; Vaccinated at start applies when a run starts. Tests per day and Contact tracing work on the people Quarantine finds; Lockdown at a threshold sets Starts at, Ends below and Stay at home; Care capacity adds a chart of people infectious now with its line.
- Try super-spreading. Set Super-spreading to a value of k, or pick the Super-spreading preset with k = 0.16. The smaller k, the more of the spread comes from a few people and the more cases infect nobody.
- Compare runs. A run ends when nobody is exposed or infectious, or at day 365. It then adds a row to the Runs table: the peak share of people infectious at once, the day of that peak, the share of people ever infected and the day the run ended, with the settings that differ between rows. Reset clears the table.
- Start outbreaks. Click on the canvas to infect the five nearest susceptible people. A click is an event in time: Restart and share links leave it out.
- Export. Save a PNG or record a video or GIF of the outbreak. With lifelong immunity, Record full run plays the run again from day 0 until it ends; with fading immunity, Record 30 s from the start records its first 30 seconds. The CSV holds the people in each state and Estimated R every 6 hours since day 0, and the Runs table.
Frequently asked questions
What is the SEIR model?
It splits a population into Susceptible, Exposed, Infectious and Recovered groups. People move from S to E when infected, from E to I when they become contagious, and from I to R when they recover. Classic SEIR models use equations for the group sizes; this tool simulates each person individually so you can see local clusters and chance events.
What is the reproduction number R?
R is the average number of new infections caused by each infected person. When R is above 1 cases grow; below 1 they decline. The basic reproduction number R₀ describes a fully susceptible population; the effective R falls as people recover, get vaccinated or reduce contacts. This tool estimates R from the people who recovered in the last few days.
What does flattening the curve mean?
Interventions that slow transmission lower and delay the peak of the epidemic curve. Even if many people are eventually infected, a lower peak means fewer people sick at the same time, which keeps hospitals from being overwhelmed. Compare the peak with and without distancing to see the effect.
What is herd immunity?
When enough people are immune, each case infects fewer than one other person on average and outbreaks fade out. For a disease with R₀ of about 2, that threshold is around half the population. Try setting Vaccinated at start to 0.5 and compare it with no vaccination.
What is super-spreading?
A few infected people causing most of the new infections. Lloyd-Smith and colleagues (2005) gave each case an infectiousness drawn from a gamma distribution with dispersion k: with R₀ = 3, the chance that one case's chain of infection dies out is 0.06 when everyone is equally infectious, 0.33 when k = 1 and 0.76 when k = 0.16, the value they estimated for SARS.
Why does contact tracing need to be fast?
Because the people a case infected can pass the disease on before they are found. Ferretti and colleagues (2020) concluded that SARS-CoV-2 spread too fast for manual contact tracing but could be controlled if tracing were faster and done at scale. Compare tracing on the same day with tracing after 5 days in the Test, trace and isolate preset.
Is this a forecast for a real disease?
No. It is an educational model with simplified behavior and made-up parameters. Real epidemic modeling uses data on contacts, age, testing and many other factors. The simulation is meant to build intuition for how transmission and interventions interact.
References
- Kermack, W. O., & McKendrick, A. G. (1927). A contribution to the mathematical theory of epidemics. Proceedings of the Royal Society A 115, 700–721.
- Lloyd-Smith, J. O., Schreiber, S. J., Kopp, P. E., & Getz, W. M. (2005). Superspreading and the effect of individual variation on disease emergence. Nature 438, 355–359.
- Ferretti, L., Wymant, C., Kendall, M., et al. (2020). Quantifying SARS-CoV-2 transmission suggests epidemic control with digital contact tracing. Science 368, eabb6936.