
Pedestrian Corridor
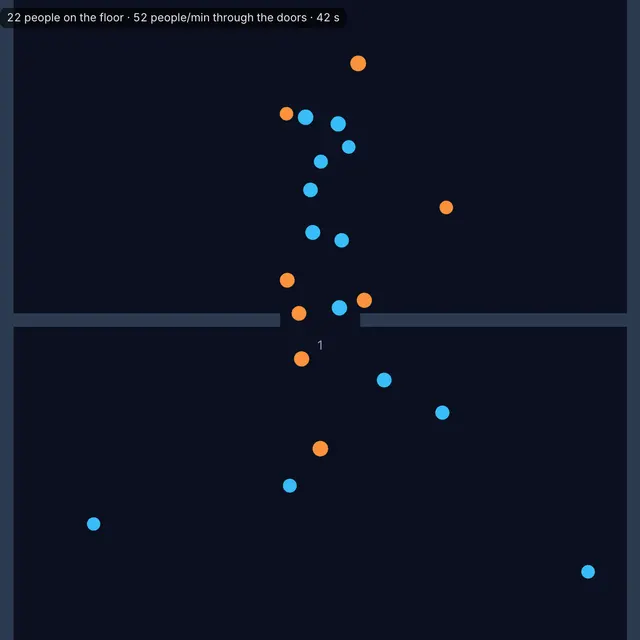
Two crowds walk a corridor in opposite directions and form lanes on their own, in the social force model.
- Walking east
- Walking west
- Counting line
- Wall
Blue people walk east (clockwise in the ring) and orange people west. Nobody is told to keep right, yet lanes of one direction form within a minute. Drag with Wall or Erase to change the corridor, or click with Pillar to place one; Rerun starts again in the corridor as drawn.
How is Pedestrian Corridor working for you?



About Pedestrian Corridor
Pedestrian Corridor simulates two crowds walking through a corridor in opposite directions. Each person is a disc with a preferred walking speed, on average 1.34 m/s with a spread of 0.26 m/s, who steers toward the far end of the corridor and keeps a distance from other people and from the walls. These rules make up the social force model of Dirk Helbing and Péter Molnár (1995). Each person also looks one second ahead, so two people on a collision course step aside before they meet (the collision prediction of Francesco Zanlungo and colleagues, 2011).
No rule in the model says to keep right or to follow someone, yet within about a minute the people walking the same way line up behind each other in lanes. Someone who follows a person going the same way meets fewer people head-on, so lanes, once started, grow. Corridor experiments with volunteers, such as those of Tobias Kretz and colleagues in 2006 and of Jun Zhang and colleagues in 2012, show the same lanes appearing on their own.
Choose a straight corridor, a ring corridor in which the two groups walk around a circle, or a corridor with pillars down the middle. Set the corridor width and the flow in each direction, draw walls and pillars, and read the number of lanes, the share of people in a lane of their own direction and the flow per meter of corridor width.
How to use Pedestrian Corridor
- Pick a layout. Straight corridor, Ring corridor and Corridor with pillars set the floor plan; Uneven flows sends three times as many people east as west, and Narrow corridor is 2 m wide.
- Set the flows. In a straight corridor, Flow east and Flow west set how many people enter at each end per second. In the ring, Walking clockwise and Walking counterclockwise set how many people walk around. Corridor width sets the distance between the walls.
- Watch lanes form. Blue people walk east (clockwise), orange people west. The readout counts lanes across the corridor at the thin line in the middle and gives the share of people in a lane of their own direction: about half for a mixed crowd, close to 100% for clean lanes.
- Read the flow. Flow is the number of people crossing the middle line per second, divided by the corridor width. The Lane order and Flow charts show both over time. In a straight corridor the dashed line is the demand, (Flow east + Flow west) ÷ width: the steady flow equals it while every arrival finds room to enter.
- Compare runs. At 60 s each run adds a row to the Runs table: the number of lanes, the share of people in a lane of their own direction and the flow, with the settings that differ between rows. Reset clears the table.
- Change the corridor. With Pointer set to Wall, Pillar or Erase, draw on the canvas; the route maps update when you release. Rerun starts the same people again from t = 0 in the corridor as drawn; Restart clears your walls and pillars and starts the layout again; Reset also returns every setting to its default.
- Export. Save a PNG or record a video or GIF. Record 30 s from the start runs the same corridor again from the beginning and records its first 30 seconds, frame by frame. The CSV holds lane order and flow every half second since t = 0, and the Runs table. A share link carries the walls and pillars you drew.
Frequently asked questions
Why do pedestrians form lanes?
Walking behind someone who goes your way is easier than meeting people head-on, because each meeting costs a step aside. In the model every person only steers toward their goal and away from others, and the lanes appear as a result. Helbing and Molnár described this self-organization in 1995, and experiments in corridors confirm it.
Do people keep to the right?
Not in this simulation. Each person steps aside to whichever side is clearer, so the lanes can sit on either side and their number changes from run to run. Lanes in the model need no habit of keeping to one side.
What is the social force model?
A model in which each pedestrian moves as if pushed by forces: a pull toward their preferred velocity, and pushes away from other people and walls that grow at short distances. It was introduced by Dirk Helbing and Péter Molnár in 1995 and is the basis of many crowd simulations. Crowd Evacuation uses the same forces for a room in an emergency.
How are lanes counted?
People within 4 m of the middle line are sorted into strips about half a meter wide across the corridor. A strip belongs to the direction with more people in it, and a lane is a run of strips of one direction. The share in their own lane is the fraction of those people who sit in a strip of their own direction.
What does flow per meter mean?
It is the number of people who pass a line across the corridor each second, divided by the corridor width, so corridors of different widths can be compared. Pedestrian studies measure capacity the same way, in people per second per meter.
Why do lanes look different in the ring?
In the ring nobody enters or leaves, so the same people keep meeting each other, and the curved walls push everyone outward a little. Lanes there form around the circle and can take longer to settle. Raise the number of people to see when the ring starts to block.
References
- Helbing, D., & Molnár, P. (1995). Social force model for pedestrian dynamics. Physical Review E 51(5), 4282–4286.
- Helbing, D., Farkas, I., & Vicsek, T. (2000). Simulating dynamical features of escape panic. Nature 407, 487–490.
- Kretz, T., Grünebohm, A., Kaufman, M., Mazur, F., & Schreckenberg, M. (2006). Experimental study of pedestrian counterflow in a corridor. Journal of Statistical Mechanics, P10001.
- Zhang, J., Klingsch, W., Schadschneider, A., & Seyfried, A. (2012). Ordering in bidirectional pedestrian flows and its influence on the fundamental diagram. Journal of Statistical Mechanics, P02002.
- Moussaïd, M., Helbing, D., & Theraulaz, G. (2011). How simple rules determine pedestrian behavior and crowd disasters. Proceedings of the National Academy of Sciences 108(17), 6884–6888.
- Zanlungo, F., Ikeda, T., & Kanda, T. (2011). Social force model with explicit collision prediction. EPL 93, 68005.